LFP Battery SOC Estimation
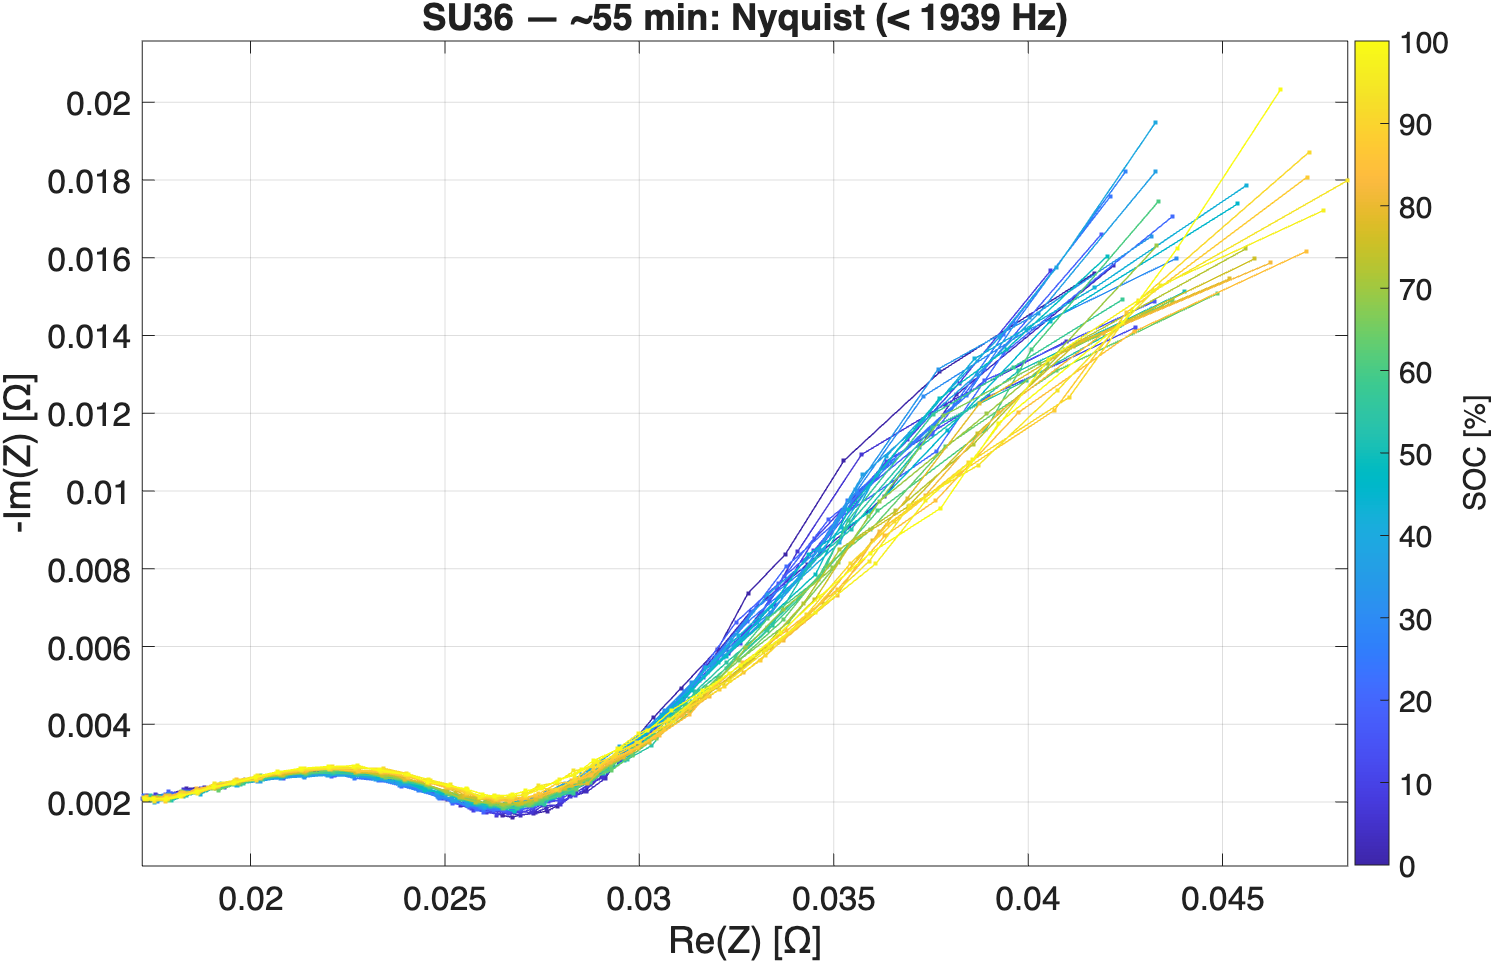
LFP batteries are becoming the dominant chemistry in EVs and grid storage, but their flat voltage curve makes it nearly impossible to estimate state of charge from voltage alone. Errors can reach 30% in the mid-SOC range. My research in Stanford's Energy Controls Lab uses electrochemical impedance spectroscopy (EIS), which probes a battery's electrical response across a spectrum of frequencies, to find impedance signatures that reliably track SOC.
Specifically, I'm identifying which frequencies carry the strongest SOC signal, whether those findings generalize across cells, and how charge/discharge direction affects the relationship. The goal is a method that could run on real battery management hardware, performing quick impedance-based SOC resets during vehicle stops, with Coulomb counting bridging the gaps.